Assigned Users
The Assigned Users chart shows the current distribution of cards within a board by assigned user. This allows you to evaluate assigned user information quickly to help determine if work is effectively allocated.
Here you'll learn how to:
- View the Assigned Users chart
- Add and remove lanes
- Calculate based on card size
- Filter the chart
- Export the chart
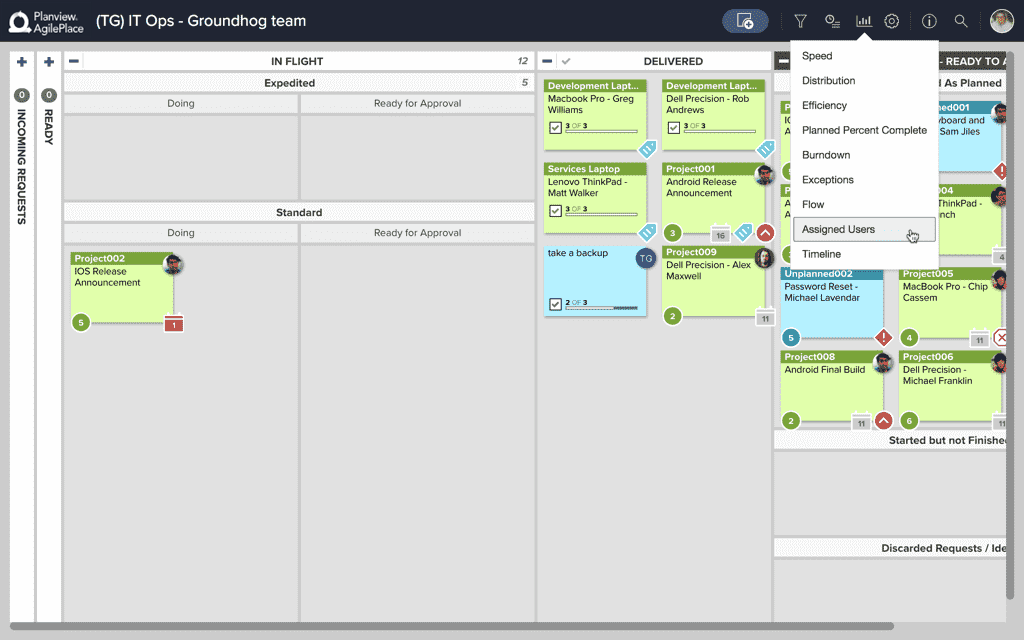
View the Assigned Users Chart
To view a board’s Assigned Users chart, click the chart icon toward the upper-right of the board and choose Assigned Users.
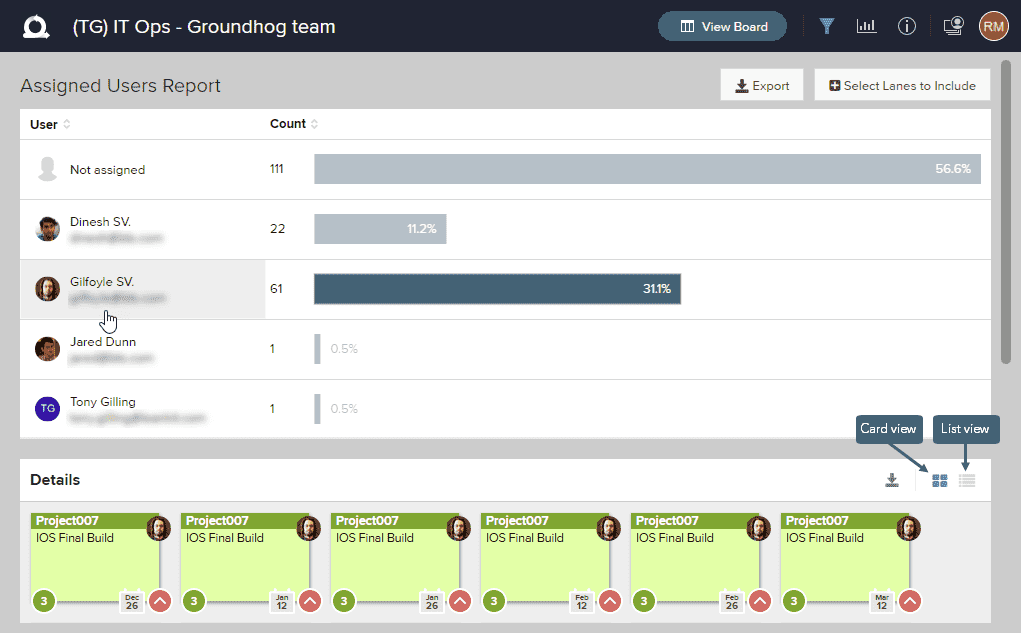
The default Assigned Users chart will display the distribution of cards assigned to each user on the board. By default, cards in all lanes will be included in the chart. You can:
- Click the arrows to sort the columns in ascending or descending order.
- Click on a user's row to view more details about the cards assigned to them.
- Switch between a card view and a list view in the Details table.
- Click on a card to view it on its board.
Add and Remove Lanes
You may wish to view the chart without all the lanes included. Click Select Lanes to Include to open a simplified representation of the lane structure on the board. You can remove lanes from the chart by clicking on the lanes in the board lane selector. Deselected lanes will turn grey, and be excluded from the chart.
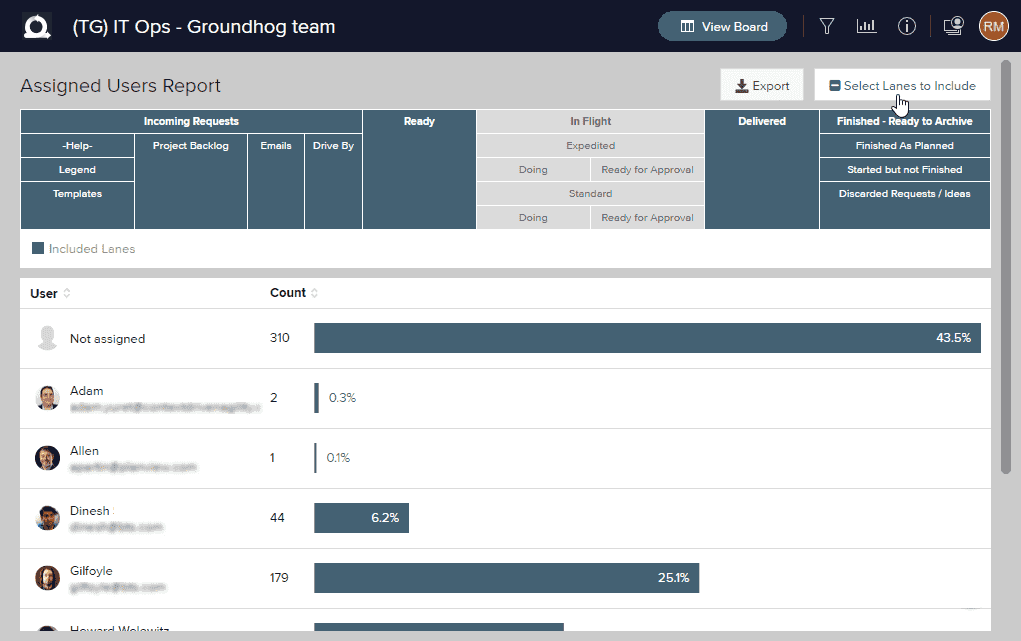
Lanes can be added back by clicking on the lane again. Any individual lane may be removed or you may remove all lanes underneath a parent lane by clicking on the parent lane.
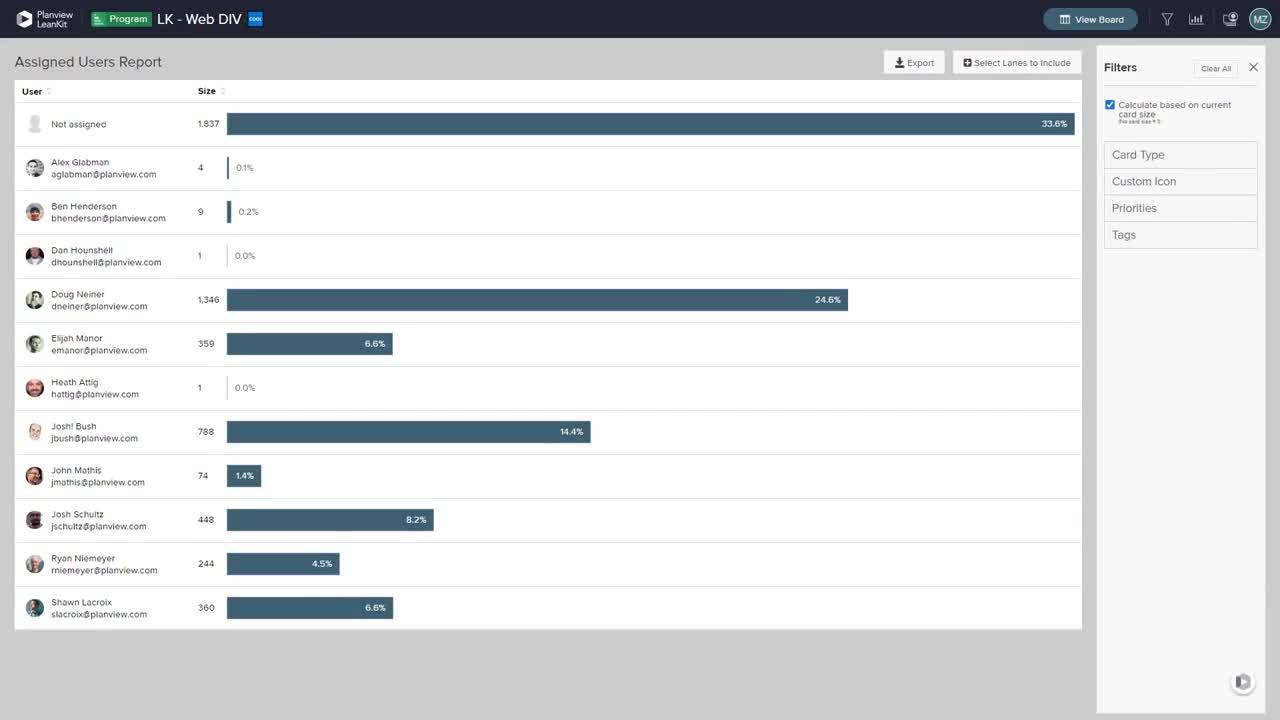
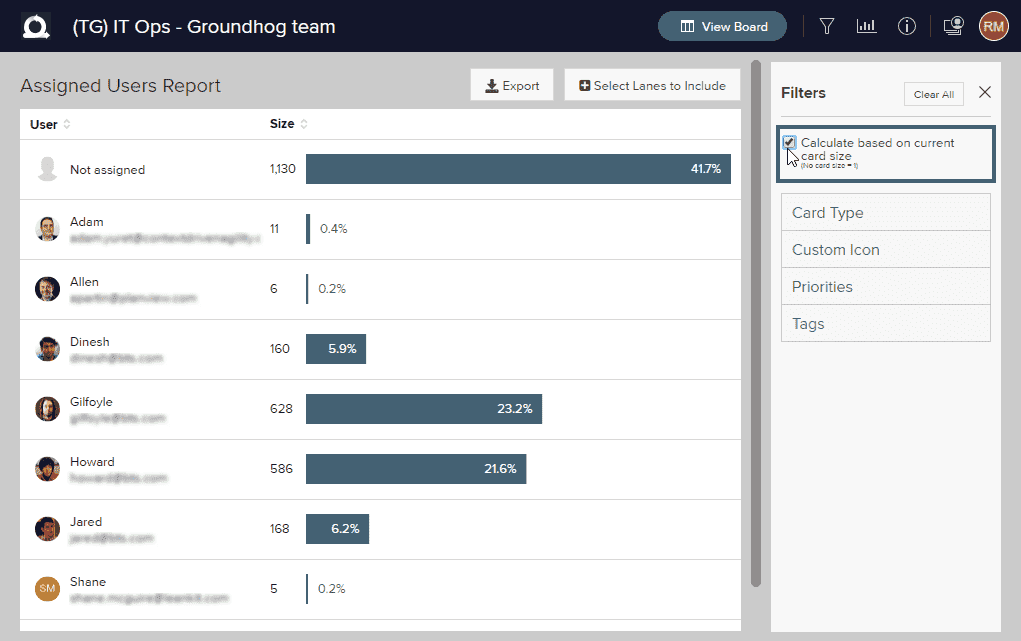
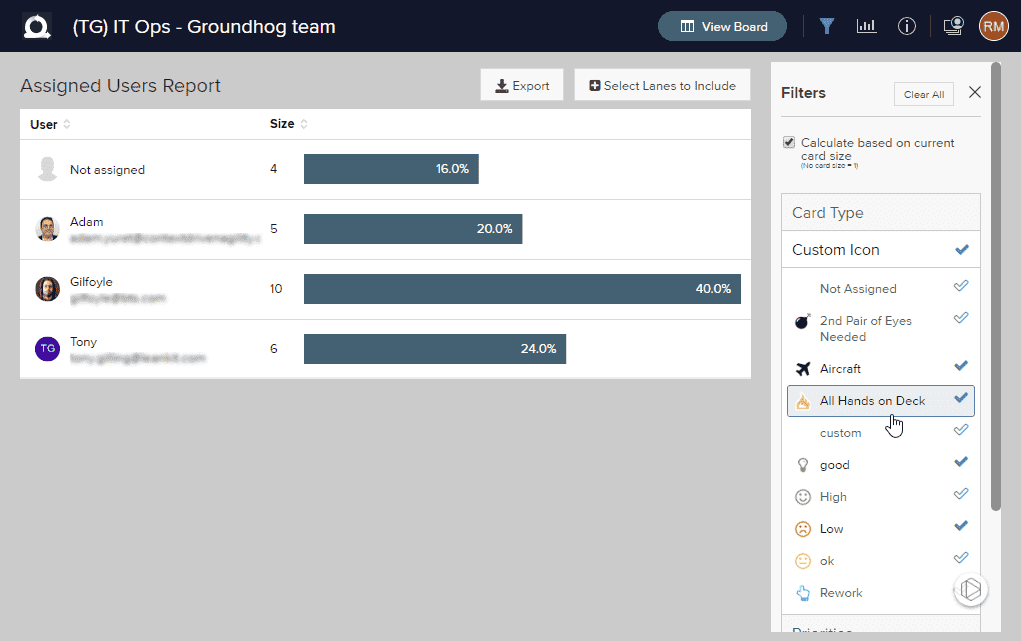
Calculate Distribution Based On Card Size
AgilePlace allows you to specify the size value within a card. These size values may represent any metric that your team uses to specify relative size of the work item. These may be hours, days, story points, complexity points, or whatever unit of measurement that your team finds useful. If your team is using the size values to specify the relative size of each card, this metric may be more useful than the number of work items within a category. For these situations, AgilePlace allows you to generate the Assigned Users chart based on the total size of the cards rather than the number of cards in a given category.
To enable the option, simply check the box next to Calculate based on Card Size. The graph will now calculate the work in progress based on the size specified within the card. Note that any work items that do not have a size specified or have a size of 0 (zero) will be considered with a size of 1 (one) when calculating size.
Filter the Chart
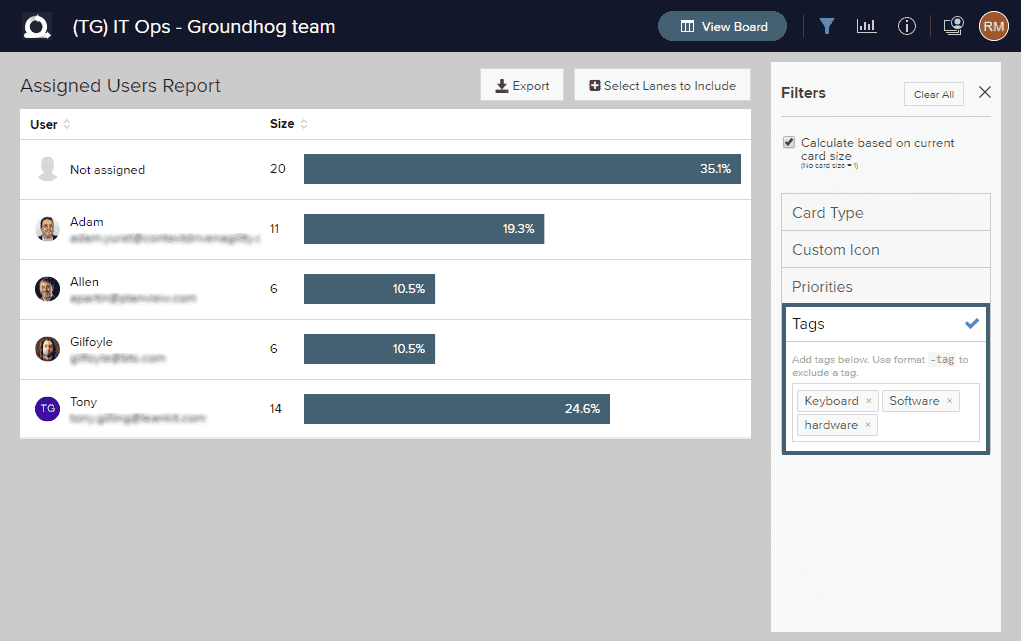
Filter by Tags
You can filter the Card Distribution chart by card tags by entering one or more tags in the field shown below. Use an exclamation point before a tag to specifically exclude cards with that tag.
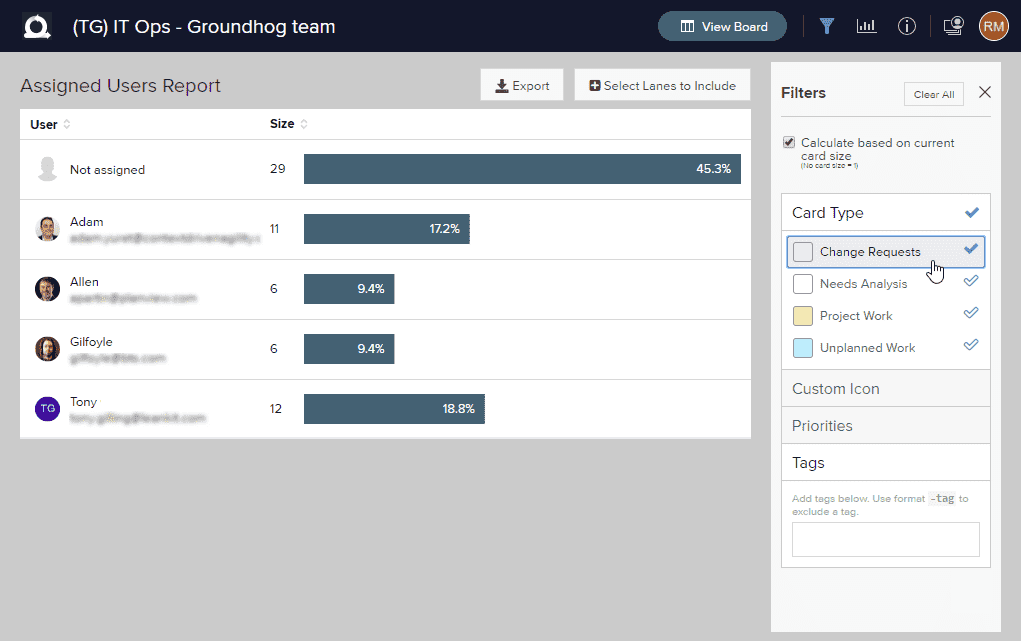
Filter by Card Type
You can filter the Card Distribution chart by card types by selecting one or more card types from the Card Types tab.
Filter by Custom Icon (Labeled Class of Service by default)
You can filter the Card Distribution chart by custom icon by selecting one or more icons from the Custom Icons tab (labeled Class of Service by default).
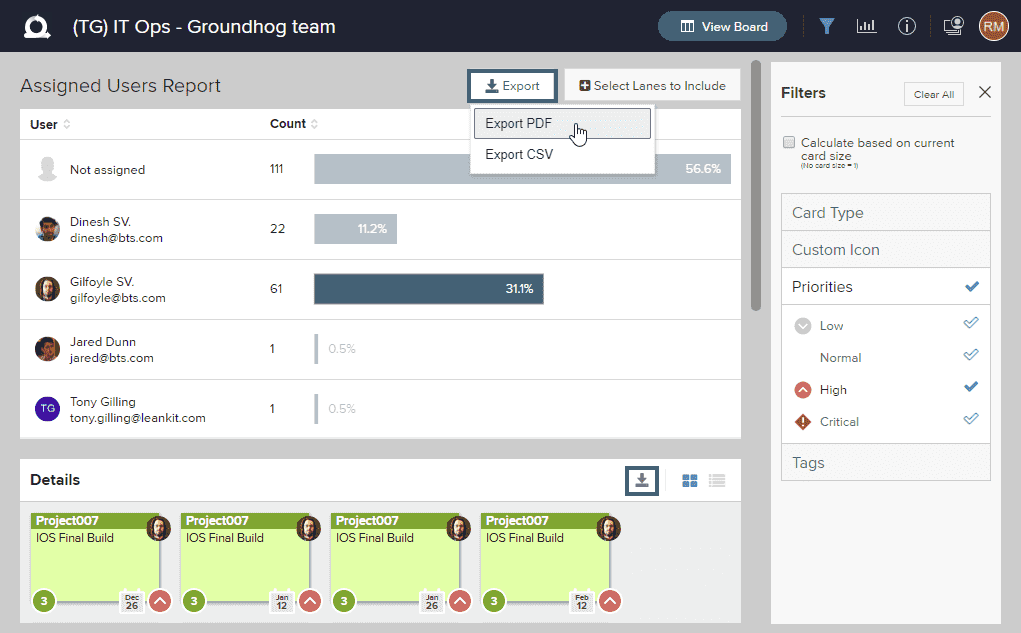
Export the Assigned Users Chart
To export the Assigned Users chart to PDF or CSV format, click the Export button and select the desired format. Note that you can export only the data in the lower table, or export all data using the Export button at the top of the report.