
Burndown Chart
Here you'll learn how to:
Access the Burndown Chart
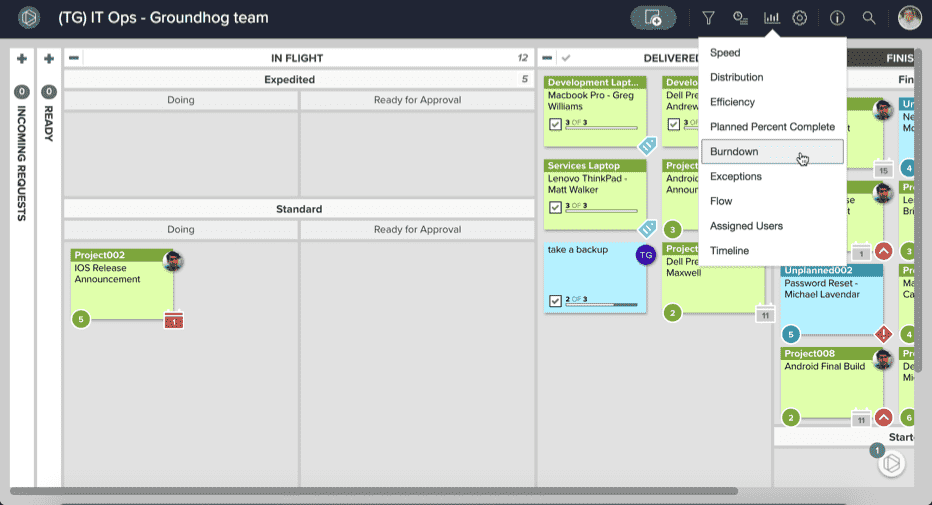
Click the chart icon in the upper right of the board and click Burndown in the drop-down menu.
This will take you directly to the burndown chart where you’ll be presented with default options.
Understand the Burndown Chart
The burndown chart in AgilePlace helps teams that have a specific amount of work to complete in a specific period of time visualize their progress and answer the question, “Are we on track to complete the planned work by the deadline/end of this iteration/sprint?"
You can use this chart during an iteration to understand if work is being completed fast enough to meet the delivery commitment. You can also use it retrospectively to understand past performance.
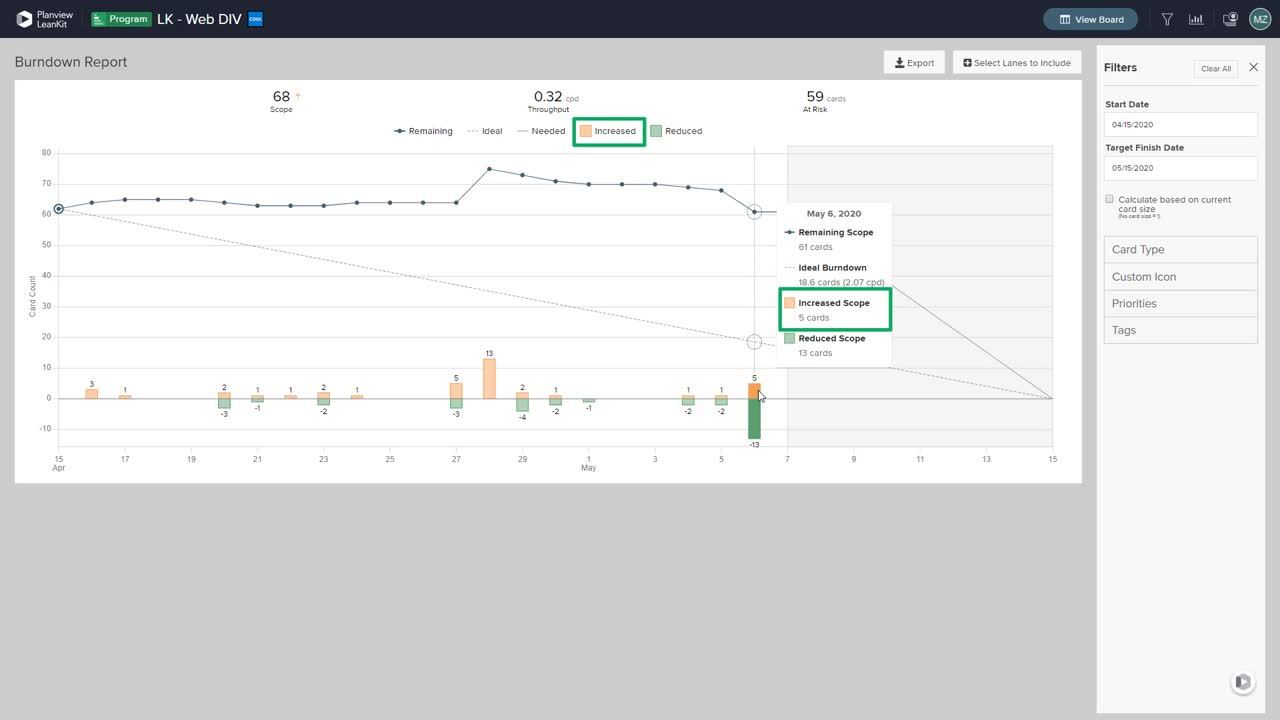
The burndown chart highlights the scope of work (original, total added, total reduced, current, & remaining), changes to scope by day (increased, decreased, remaining), throughput (ideal, actual, and needed), and how many cards or card sizes may be at risk of missing the specified deadline.
- Original Scope is defined as the total number of cards/sizes that existed in selected green lanes at the beginning of the start date, plus any cards/sizes added to or created in green lanes on the start date. This number is marked with an open circle on Day 1 at the Y axis of the chart.
- Added Scope is defined as any cards/sizes added to or created in green lanes on days that fall after the start date and before the finish date. This is also shown as Increased Scope in the form of an orange bar on days when scope was added.
- Reduced Scope is defined as any cards/sizes that were initially considered part of the original scope but have moved to gray lanes (after the start date and before the finish date). This is also shown in the form of a green bar on days when scope was reduced.
- Current Scope is defined as Original Scope plus Added Scope minus Reduced Scope.
- Remaining Scope is defined as Current Scope minus any cards that have been moved into completed red lanes between start and target finish dates. This is also represented on the chart with small dots each day, describing how much Current Scope remains as of 11:59:59 PM (local time zone) on that day.
- Throughput (Actual Throughput) is defined as the number of cards/sizes that have been completed between the start date and today, divided by the number of days since the start date, measured in Cards/Sizes Per Day (cpd/spd).
- For example, if your Start Date is Jan 1 and today is Jan 10, and you have completed 20 cards/sizes from your scope, your Throughput would be 2cpd/spd (20 cards / 10 days = 2cpd).
- Ideal Throughput is defined as the original scope divided by the number of days that exist between Start and Target Finish dates.
- For example, if your Start Date is Jan 1, your Target Finish Date is Jan 20, and your Original Scope is 20 cards/sizes, then your Ideal Throughput would be 1cpd/spd (20 cards / 20 days = 1cpd).
- Needed Throughput is defined as today’s Remaining Scope divided by the number of days until your Target Finish Date. Needed Throughput tells you the minimum average daily rate of which you should be finishing cards/sizes to have all work completed by your Target Finish Date.
- Cards At Risk is defined as the number of cards/sizes that would not be completed by your Target Finish Date assuming you continue your current daily Throughput.
- For example, if your Throughput is 5 cpd, your Remaining Scope is 20 cards, and your Target Finish Date is 3 days from today, you would have 5 cards at risk (5 cpd x 3 days = 15 cards & 20 cards of remaining scope – 15 projected completed cards = 5 cards at risk).
Configure the Burndown Chart
Here you'll learn how to:
Set Start and Finish Lanes
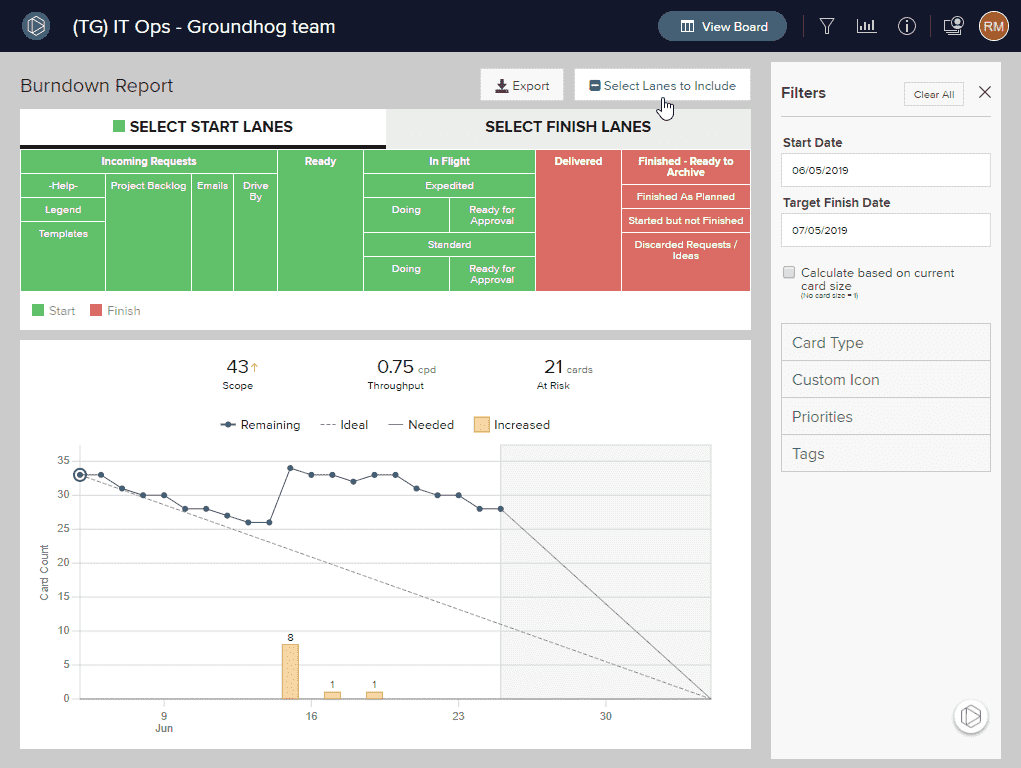
To select start and finish lanes to include in the Burndown chart, Click Select Lanes to Include above the burndown chart to open a simplified representation of the lane structure on the board.
Lane(s) included as start lanes in the chart are green and the lanes included as the finish lanes are red.
-
To exclude a lane from the diagram, click on the lane title of an included lane. Deselected lanes will turn grey and will be excluded from the diagram.
-
To include a lane as a start lane, click SELECT START LANES and click on the lane title of an excluded lane where all of the planned work for the upcoming iteration starts. Included start lanes will be green.
-
To include a lane as the finish lane, click SELECT FINISH LANE and click on the lane title of an excluded lane where all of the work completed in the iteration finishes. The included finish lane will be red.
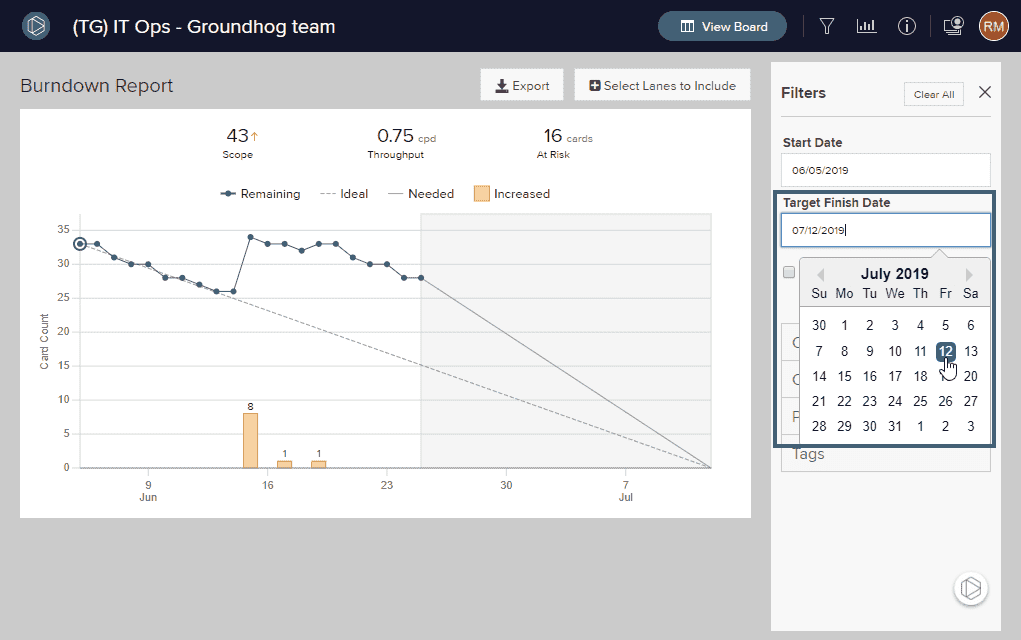
Set the Date Range
To set the date range for the Burndown chart, click within either date field and type in the desired date or select the date from the calendar selector.
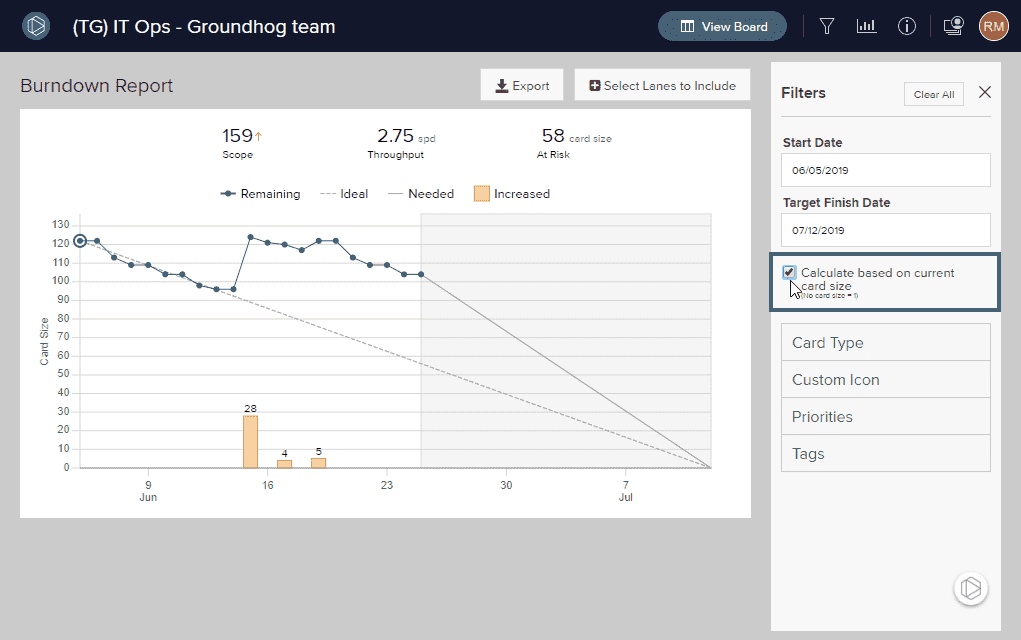
Calculate Burndown Based On Card Size
AgilePlace allows you to specify the size value within a card. These size values may represent any metric that your team uses to specify relative size of the work item: hours or days of work, cost of delay, story points, complexity points, or whatever unit of measurement that your team finds useful. If your team is using the size values to specify the relative size of each card, this metric may be more useful than the number of work items within a lane. For these situations, AgilePlace allows you to generate the burndown diagram based on the total size of the cards rather than the number of cards in the lane.
To calculate burndown based on card size, check the box Calculate based on Card Size.
NOTE
Any work items that do not have a size specified or have a size of 0 (zero) will be considered as a size of 1 (one) when calculating queue size.
Filter the Chart
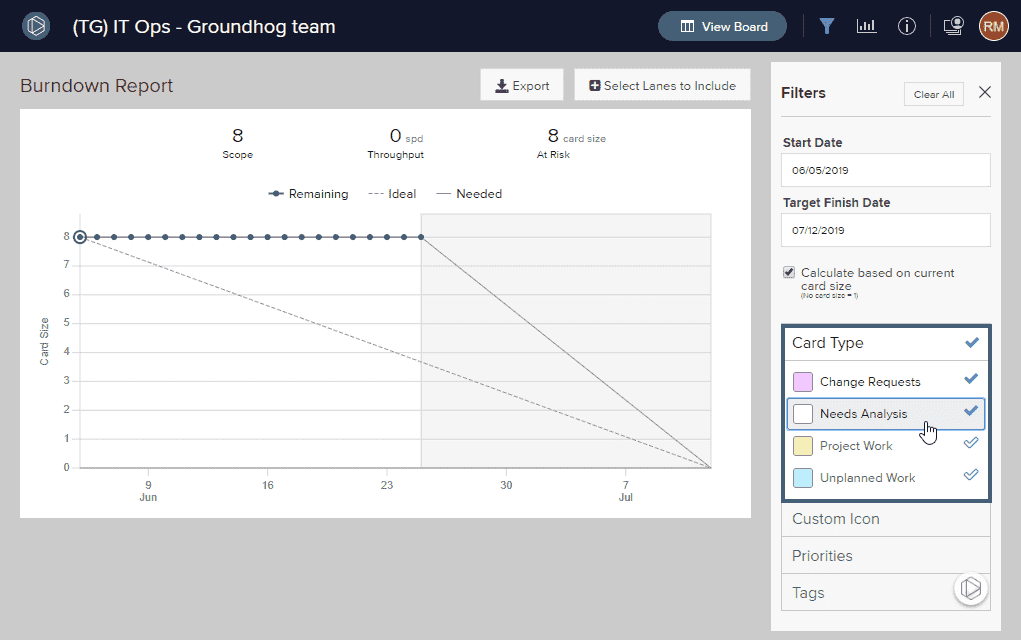
Filter by Card Type
To filter the chart by card type, click Card Type to the right of the chart and in the list below click on the card types you want to include.
Filter by Custom Icon
To filter the chart by Custom Icon, click Custom Icon (labeled Class of Service by default) and in the list below click on the custom icons you want to include.
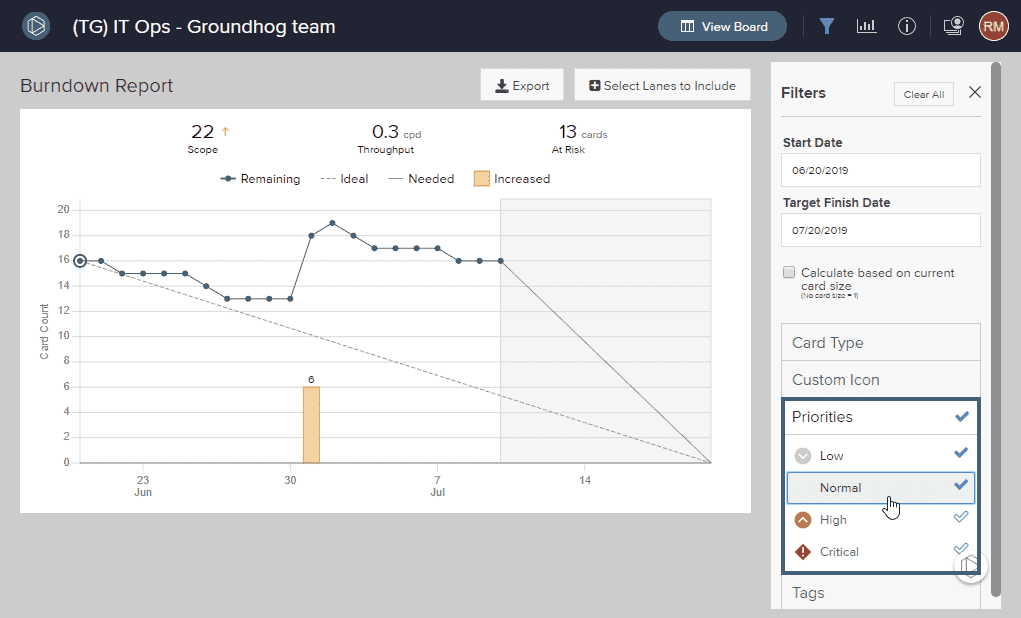
Filter by Priority
To filter the chart by Priority, click Priorities and in the list below click on the priorities you want to include.
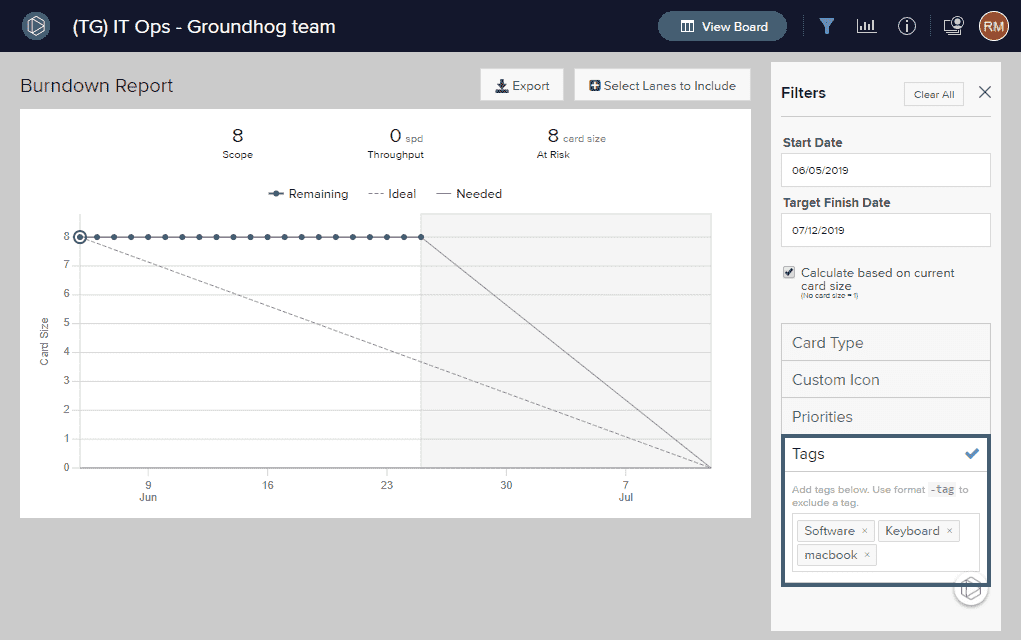
Filter by Tags
To filter the burndown chart by card tags, enter the desired tags in the Tags box to the right of the chart.
Use an exclamation point before a tag to specifically exclude cards with that tag.
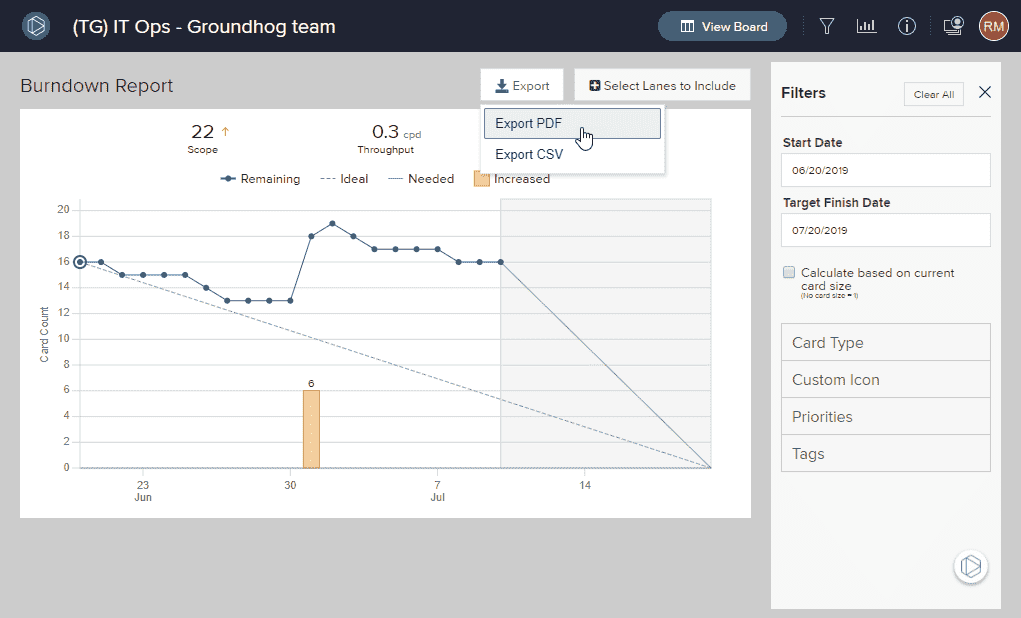
Export the Burndown Chart
To export the Burndown chart to PDF or CSV format, click the Export button and select the desired format.
The following fields are included in the CSV export:
- cardId
- title
- header
- cardTypeName
- cardTypeId
- customIconName
- customIconId
- priority
- laneName
- laneId
- tags
- plannedStartDate
- plannedFinishDate
- effectiveCardSize
- isBlocked
- blockReason
- dateInScope
- DateRemovedFromScope
- inOriginalScope
- removedFromScope
- burndownDate